🔍 Navigating the Dashboard
🟦 Overview
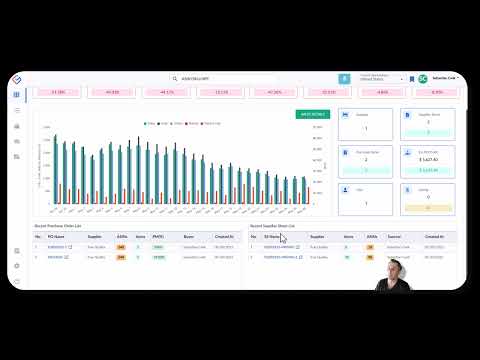
Click the image above to watch the full tutorial on YouTube.
The Source Correct dashboard is designed to give you clear access to every core function of your operation — from sourcing ASINs and uploading supplier sheets to managing purchase orders, prepping inventory, and shipping to Amazon.
This article breaks down the persistent elements, sidebar navigation, and what to expect when logging in for the first time.
🧭 Persistent Header (Top Left to Right)
The top header remains consistent across all screens and includes tools for knowledge access, view-specific help, and system-level actions.
| ELEMENT | DESCRIPTION |
| Knowledge Base | Opens the full Source Correct Help Center in a new tab — includes guides for each feature and module |
| Learn More About This View | A context-sensitive helper that will show walkthroughs and linked documentation based on the page you're on |
| Global ASIN Search Bar | Allows you to search your full Seller Central catalog — see ASIN/SKU details, sales history, prep requirements, bundle breakdowns, and more |
| Import SKU | Use this to bring in any SKU from your Seller Central account that hasn’t yet been synced to Source Correct |
| Marketplace Dropdown | If you’re subscribed to multiple marketplaces (e.g., US and Canada), switch between them here |
| Watchlist ASINs | Quickly access the list of ASINs you’ve flagged for future review or order consideration |
| Account Dropdown |
Access settings or log out from your Source Correct account |
📚 Persistent Sidebar Navigation (Left Side)
The left-hand sidebar is a persistent navigation panel that remains visible across all screens. It provides direct access to all core modules of Source Correct.
| ICON | MODULE |
DESCRIPTION |
| Company Dashboard | High-level overview of your team’s activity, purchase trends, and sourcing status | |
| Supplier Sheets | Upload, map, and scrape supplier files for product sourcing | |
| Purchase Orders | View, create, and manage POs, linked directly to supplier data | |
| Inventory Management |
Review all SKUs in your Seller Central catalog, and quantity you have in Amazon fulfillment centers. |
|
| Shipments | View and manage all outgoing shipments. Each shipment links to its Production Screen (your prep interface) | |
| Weekly Snapshot | View a macro-level snapshot of what’s inbound (POs) and outbound (shipments) for the week | |
| Settings | Manage user permissions, shipping & label settings and other preferences | |
| Logout | Securely log out of your Source Correct account |
🖥 Company Dashboard View
When users log in, they land on the Company Dashboard — your operational control panel. It gives you real-time insight into sales performance, supplier activity, team engagement, and profitability.
📆 Date Range Selector
At the top of the Dashboard, you’ll find a date range dropdown, defaulted to 30 days.
-
Choose from:
-
1 week
-
30 days
-
90 days
-
180 days
-
1 year
-
Or use the custom calendar (“From” and “To”) to select a custom range.
-
All metrics below update dynamically based on your selected range.
📊 KPI Summary Cards (Top Row)
There are 8 cards showing key financial and order-level KPIs, each with previous period percentage comparison:
| KPI | DESCRIPTION |
| Sales | Total revenue for the selected period |
| Total Orders | Number of customer orders processed |
| Units Sold | Total item count shipped to customers |
| Refunds | Total amount of refunds |
| Total Fees |
Combined FBA and Amazon referral fees |
| Total Returns | Count of returned items |
| Average Order Value | Dollar value per order on average |
| Average Unit Value | Dollar value per unit sold on average |
📈 Performance Bar Chart
Below the KPI summary cards, you'll find a bar chart with daily breakdowns of:
-
Sales
-
Units
-
Orders
-
Refunds
-
Refund Cost
This visual helps track day-over-day performance across the selected time frame.
📦 Secondary KPIs (Right of Graph)
To the right of the bar chart are 6 additional KPIs:
| KPI | DESCRIPTION |
| Suppliers | Total number of suppliers in your system |
| Supplier Sheets | Number of supplier sheets scraped during selected period |
| Purchase Orders | Number of POs created during selected period |
| Estimated PO Profit | Projected gross profit from all POs created and submitted in this period |
| Users | Total number of team members on your Source Correct account |
| SKUs Created | Number of new SKUs created through Listing Creation view in Source Correct |
🧾 Recent Purchase Orders (Bottom Left)
A table displaying the 10 most recently created POs, with the following details:
-
PO Name (hyperlinked)
-
Supplier
-
ASINs (on the PO)
-
Items (unique UPCs)
-
PM% (projected profit margin)
-
Buyer (creator of the PO)
-
Created At (date PO was submitted)
📁 Recent Supplier Sheets (Bottom Right)
A parallel table showing the 10 most recently scraped supplier sheets:
-
Sheet Name (hyperlinked)
-
Supplier
-
Items (on sheet)
-
ASINs Found (on the sheet)
-
Sourcer (user who uploaded it)
-
Created At (upload date)
🔐 Role-Based Views
What users can see or interact with depends on their role:
-
Buyers typically upload sheets, create POs, and run analysis
-
Warehouse users typically only see shipping and receiving modules
-
Admins have access to all modules, including settings and company-wide dashboards
These are our recommendations based on role-type, but Source Correct permissions are adaptable — you can have a “Buyer” who can access shipping or production, or a “Warehouse” user with visibility into POs. It’s all up to you.
🎨 Visual Indicators & UX Cues
Many Source Correct modules use:
-
Color-coded status tags
-
Progress bars
-
Error indicators
-
Prep requirement icons
These visual cues help teams quickly interpret data without needing to open each item.
Example: ASINs missing prep info will show a warning badge in the Prep Screen
🔎 Search & Filters
Most views — including Supplier Sheets, PO Builder, and Shipments — include:
-
Search fields for SKUs, ASINs, or suppliers
-
Date pickers and dropdown filters to narrow results
-
Sorting tools (e.g., by status, newest first, etc.)